Illumination discrimination in the absence of a fixed surface-reflectance layout
Supplemental Material
Ana
Radonjić, Xiaomao Ding, Avery
Krieger, Stacey Aston, Anya C.
Hurlbert and David H.
Brainard
Instructions
Experiment 1: pdf
Experiment
2: pdf
Comparison illumination tables.
Table specifying the difference between the target and
comparison illuminations in ΔE L*u*v* units are provided as tab
delimited text (txt).
In producing the tables, target illuminant CIEXYZ
coordinates are used as the reference white point (for illuminant
spectra to XYZ to L*u*v* conversion).
We also provide image-based lookup tables for each of our experiments. In these tables we provide the differences (ΔE L*u*v* units) between
each comparison illumination test image and the mean target image
(averaged across all 30 target images). In producing the tables, we
used image-based white pointsfor mean image XYZ to L*u*v* conversion; these differ slighty across experiments (see manuscript for more details on these computations).
Each table provides values for all test images in the fixed-surfaces
condition (columns 2-5) and in the shuffled-surfaces condition (columns
6-9). Column headers indicate illumination-change direction and
condition. Tables are provied as tab
delimited text for Experiment 1, Experiment 2 and Experiment 1A.
Follow-up questionnaires:
Experiment 1 (pdf),
Experiment 2 (pdf),
Experiment A1 (pdf).
Thresholds. The tables
below provide
individual subject data for each experiment and condition as tab delimited text.
Each row corresponds to one subject (subject numbers are assigned
arbitrarily) and shows measured thresholds for each illuminant
direction for each block of trials (as indicated by the header labels).
In the shuffled-surfaces condition, asterisks denote estimated
thresholds when the measured threshold in a given block falls out of
the stimulus range. In the fixed-surfaces condition, NaN values denote
cases where the thresholds fell outside of stimulus range.
Experiment 1: Fixed-surfaces,
Shuffled-surfaces.
(note: subject #11 was excluded after the second fixed-surfaces session;
second block in the shuffled-scene condition was not run in this case
and corresponding threshold values are denoted with NaNs.)
Experiment A1: Fixed-surfaces,
Shuffled-surfaces.
(note:
subject #11 was excluded after the second fixed-surfaces session; second
block in the shuffled-scene condition was not run in this case and
corresponding threshold values are denoted with NaNs; subject 11 in this experiment
is a different individual than subject #11 in Experiment 1 above.)
Experiment 2: Fixed-surfaces,
Shuffled-surfaces.
Eye-movement data.
Proportion of dropped-trials per
each observer, condition and trial block of trials is provided as txt table.
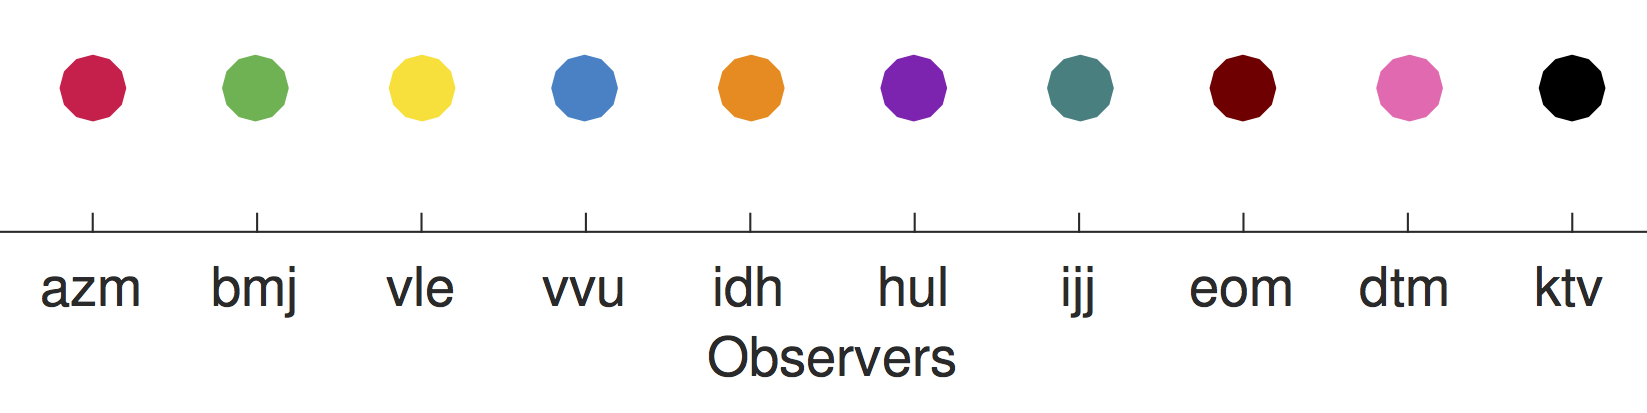
Observer color mapping code for
Figures 6, 7, 8 and 9 as well as figures B1, B2, B3 and B4 in the
supplement is shown below.
Raw eye position data. For
each observer and condition we provide three pairs of table, one for
each trial interval (target, first comparison, second comparison). Each
pair consists of a x coordinates table and a y coordinate table.
The first row in a table indicates a block number (1 or 2), the second
row indicates the trial number within that block. For each trial, we
then provide x / y eye coordinate for the duration of the trial (in
pixels
relative to the upper left corner of the screen). Position at first
millisecond of
the trial is shown in row 3, position in the next millisecond in row 4
and so forth. Each table is padded with Inf values. These indicate
that a given trial has ended. NaN values indicate the missing data on
the eye position in the course of the trial.
Surface reflectance distribution. For
each observer we plot the relative distribution of fixations across
reflectances. Fixations are aggregated across trials and plotted for
each condition and interval. Fixed-surfaces condition is shown in
black, shuffled-surfaces condition is shown in white. For each
condition, target interval data is indicated with solid line, first
comparison interval data with dashed and second comparison interval
data with dotted line. Each surface reflectance is indicated with a
square symbol (x-axis) whose RGB values correspond to colors used in
Figure 5. Black leftmost reflectance corresponds to the stimulus scene
background. Pink rightmost reflectance corresponds to the reflectance
assigned by Blender (consequence of the typo in the mapping file).
Eye fixation distribution across
conditions. The figures follow the same formating style as
Figure 5 in the paper. For each condition and interval fixations are
aggregated across all trials and overlaid onto the corresponding
locations in the stimulus image (white circles). For each condition,
each interval is presented in a separate figure. Figures show fixations
over the entire display. Tile colors shown in this figure are for
illustration purposes only.
Experiment
2:
(1) Observer AZM
Raw data:
Fixed-surfaces: TargetIntX
TargetIntY
1stComparisonIntX
1stComparisonIntY
2ndComparisonIntX
2ndComparisonIntY
Shuffled-surfaces: TargetIntX
TargetIntY
1stComparisonIntX
1stComparisonIntY
2ndComparisonIntX
2ndComparisonIntY
Eye fixations distributions:
Fixed-surfaces: TargetInterval
1stComparisonInterval
2ndComparisonInterval
Shuffled-surfaces: TargetInterval
1stComparisonInterval
2ndComparisonInterval
Surface reflectance distribution (pdf)
(2) Observer BMJ
Raw data:
Fixed-surfaces: TargetIntX
TargetIntY
1stComparisonIntX
1stComparisonIntY
2ndComparisonIntX
2ndComparisonIntY
Shuffled-surfaces: TargetIntX
TargetIntY
1stComparisonIntX
1stComparisonIntY
2ndComparisonIntX
2ndComparisonIntY
Eye fixations distributions:
Fixed-surfaces: TargetInterval
1stComparisonInterval
2ndComparisonInterval
Shuffled-surfaces: TargetInterval
1stComparisonInterval
2ndComparisonInterval
Surface reflectance distribution (pdf)
(3) Observer VLE
Raw data:
Fixed-surfaces: TargetIntX
TargetIntY
1stComparisonIntX
1stComparisonIntY
2ndComparisonIntX
2ndComparisonIntY
Shuffled-surfaces: TargetIntX
TargetIntY
1stComparisonIntX
1stComparisonIntY
2ndComparisonIntX
2ndComparisonIntY
Eye fixations distributions:
Fixed-surfaces: TargetInterval
1stComparisonInterval
2ndComparisonInterval
Shuffled-surfaces: TargetInterval
1stComparisonInterval
2ndComparisonInterval
Surface reflectance distribution (pdf)
(4) Observer VVU
Raw data:
Fixed-surfaces: TargetIntX
TargetIntY
1stComparisonIntX
1stComparisonIntY
2ndComparisonIntX
2ndComparisonIntY
Shuffled-surfaces: TargetIntX
TargetIntY
1stComparisonIntX
1stComparisonIntY
2ndComparisonIntX
2ndComparisonIntY
Eye fixations distributions:
Fixed-surfaces: TargetInterval
1stComparisonInterval
2ndComparisonInterval
Shuffled-surfaces: TargetInterval
1stComparisonInterval
2ndComparisonInterval
Surface reflectance distribution (pdf)
(5) Observer IDH
Raw data:
Fixed-surfaces: TargetIntX
TargetIntY
1stComparisonIntX
1stComparisonIntY
2ndComparisonIntX
2ndComparisonIntY
Shuffled-surfaces: TargetIntX
TargetIntY
1stComparisonIntX
1stComparisonIntY
2ndComparisonIntX
2ndComparisonIntY
Eye fixations distributions:
Fixed-surfaces: TargetInterval
1stComparisonInterval
2ndComparisonInterval
Shuffled-surfaces: TargetInterval
1stComparisonInterval
2ndComparisonInterval
Surface reflectance distribution (pdf)
(6) Observer HUL
Raw data:
Fixed-surfaces: TargetIntX
TargetIntY
1stComparisonIntX
1stComparisonIntY
2ndComparisonIntX
2ndComparisonIntY
Shuffled-surfaces: TargetIntX
TargetIntY
1stComparisonIntX
1stComparisonIntY
2ndComparisonIntX
2ndComparisonIntY
Eye fixations distributions:
Fixed-surfaces: TargetInterval
1stComparisonInterval
2ndComparisonInterval
Shuffled-surfaces: TargetInterval
1stComparisonInterval
2ndComparisonInterval
Surface reflectance distribution (pdf)
(7) Observer IJJ
Raw data:
Fixed-surfaces: TargetIntX
TargetIntY
1stComparisonIntX
1stComparisonIntY
2ndComparisonIntX
2ndComparisonIntY
Shuffled-surfaces: TargetIntX
TargetIntY
1stComparisonIntX
1stComparisonIntY
2ndComparisonIntX
2ndComparisonIntY
Eye fixations distributions:
Fixed-surfaces: TargetInterval
1stComparisonInterval
2ndComparisonInterval
Shuffled-surfaces: TargetInterval
1stComparisonInterval
2ndComparisonInterval
Surface reflectance distribution (pdf)
(8) Observer EOM
Raw data:
Fixed-surfaces: TargetIntX
TargetIntY
1stComparisonIntX
1stComparisonIntY
2ndComparisonIntX
2ndComparisonIntY
Shuffled-surfaces: TargetIntX
TargetIntY
1stComparisonIntX
1stComparisonIntY
2ndComparisonIntX
2ndComparisonIntY
Eye fixations distributions:
Fixed-surfaces: TargetInterval
1stComparisonInterval
2ndComparisonInterval
Shuffled-surfaces: TargetInterval
1stComparisonInterval
2ndComparisonInterval
Surface reflectance distribution (pdf)
(9) Observer DTM
Raw data:
Fixed-surfaces: TargetIntX
TargetIntY
1stComparisonIntX
1stComparisonIntY
2ndComparisonIntX
2ndComparisonIntY
Shuffled-surfaces: TargetIntX
TargetIntY
1stComparisonIntX
1stComparisonIntY
2ndComparisonIntX
2ndComparisonIntY
Eye fixations distributions:
Fixed-surfaces: TargetInterval
1stComparisonInterval
2ndComparisonInterval
Shuffled-surfaces: TargetInterval
1stComparisonInterval
2ndComparisonInterval
Surface reflectance distribution (pdf)
(10) Observer KTV
Raw data:
Fixed-surfaces: TargetIntX
TargetIntY
1stComparisonIntX
1stComparisonIntY
2ndComparisonIntX
2ndComparisonIntY
Shuffled-surfaces: TargetIntX
TargetIntY
1stComparisonIntX
1stComparisonIntY
2ndComparisonIntX
2ndComparisonIntY
Eye fixations distributions:
Fixed-surfaces: TargetInterval
1stComparisonInterval
2ndComparisonInterval
Shuffled-surfaces: TargetInterval
1stComparisonInterval
2ndComparisonInterval
Surface reflectance distribution (pdf)